Analyze and Visualize your Dataset
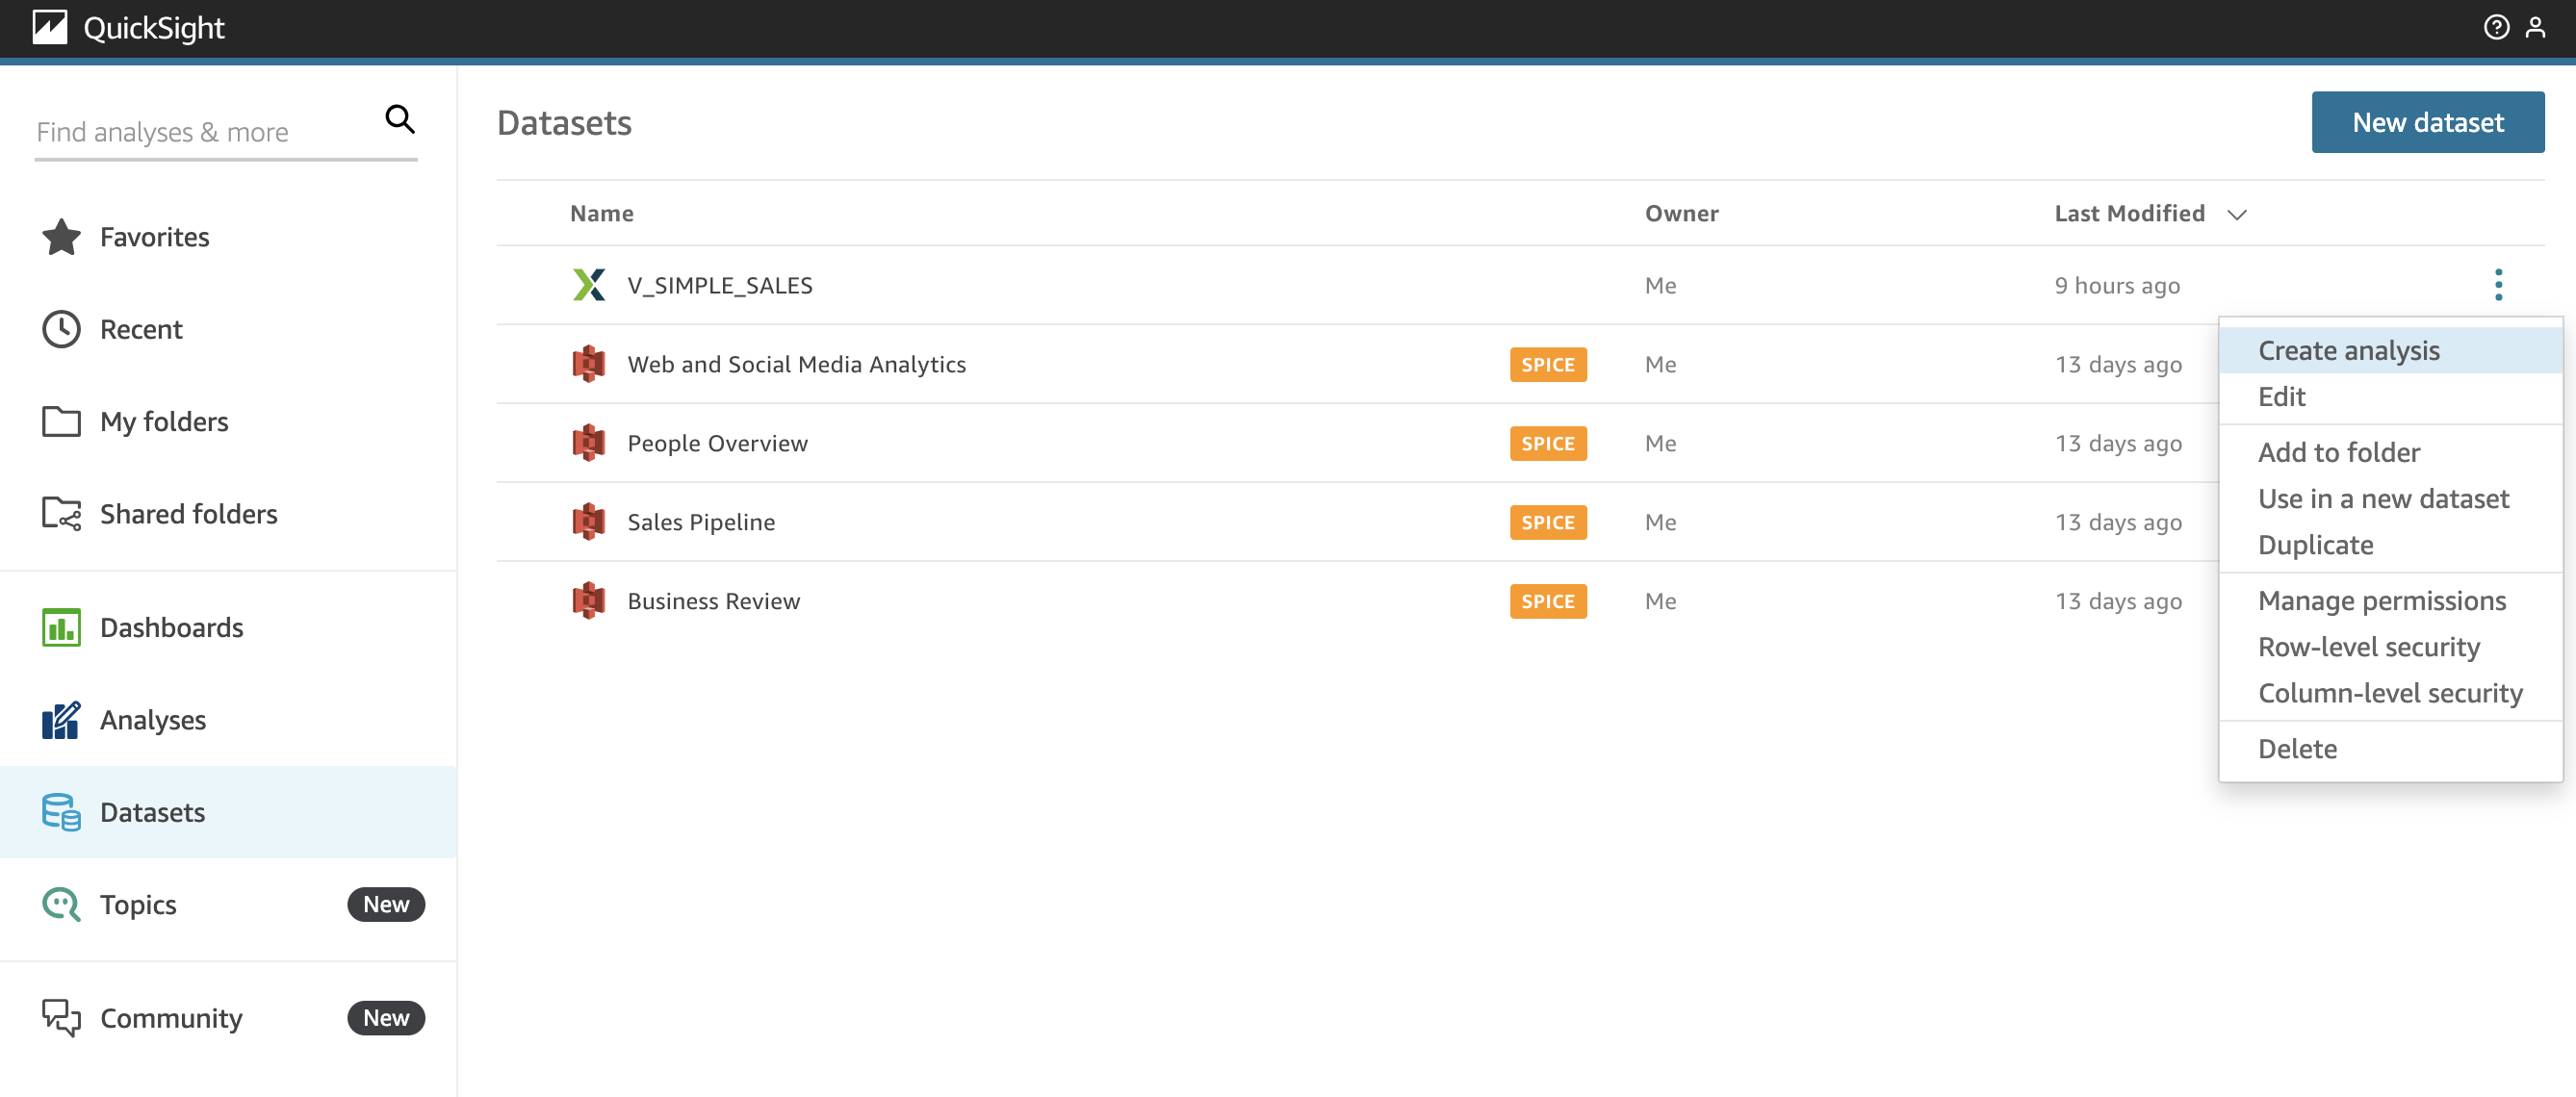
To create an analysis from the newly created V_SIMPLE_SALES dataset navigate to the Datasets page. Locate the V_SIMPLE_SALES dataset and click on the three dots and select “Create analysis”.
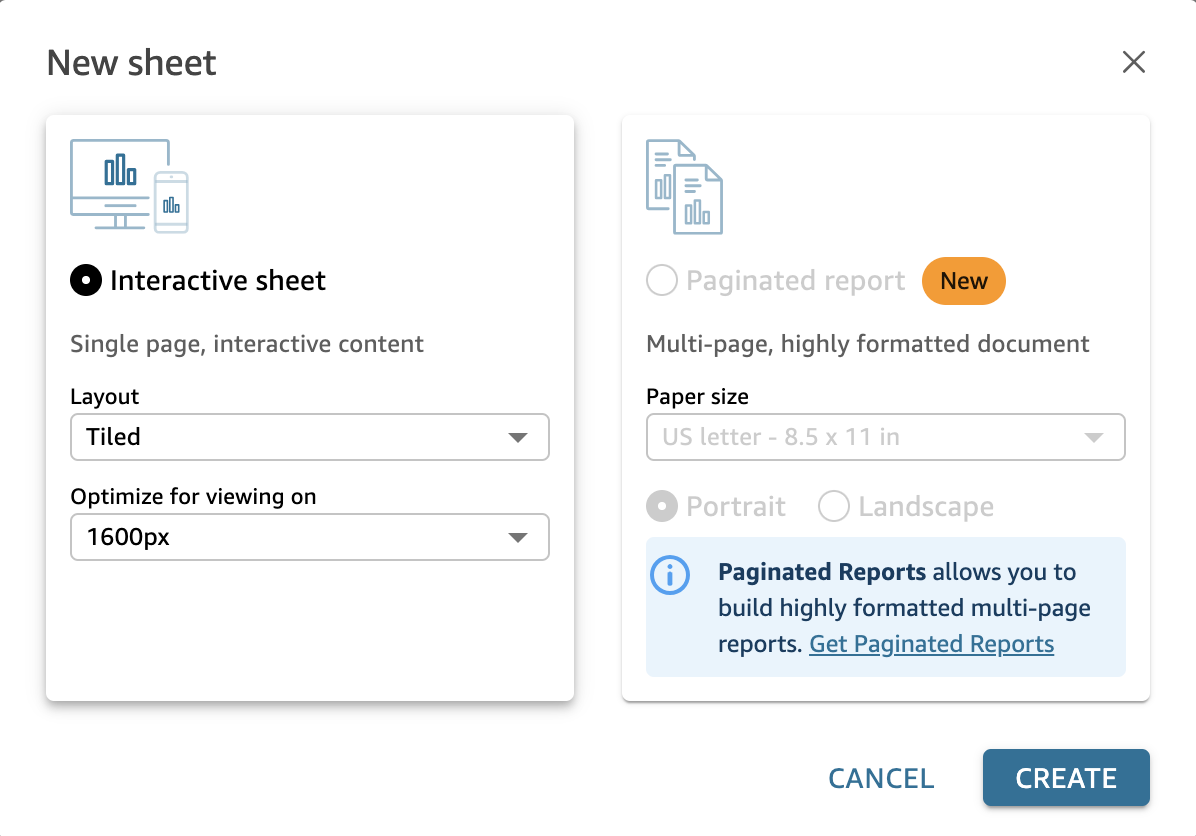
Once you click on “Create analysis”, QuickSight will redirect you to a new page, where you will have to choose what sheet you want to create. Choose the “Interactive sheet” option and click “Create”.
For this tutorial, as we start, we will query over the entire data set, “leaving date and time out of the equation.” In principal, using date and/or time is not different from what we will prepare now.
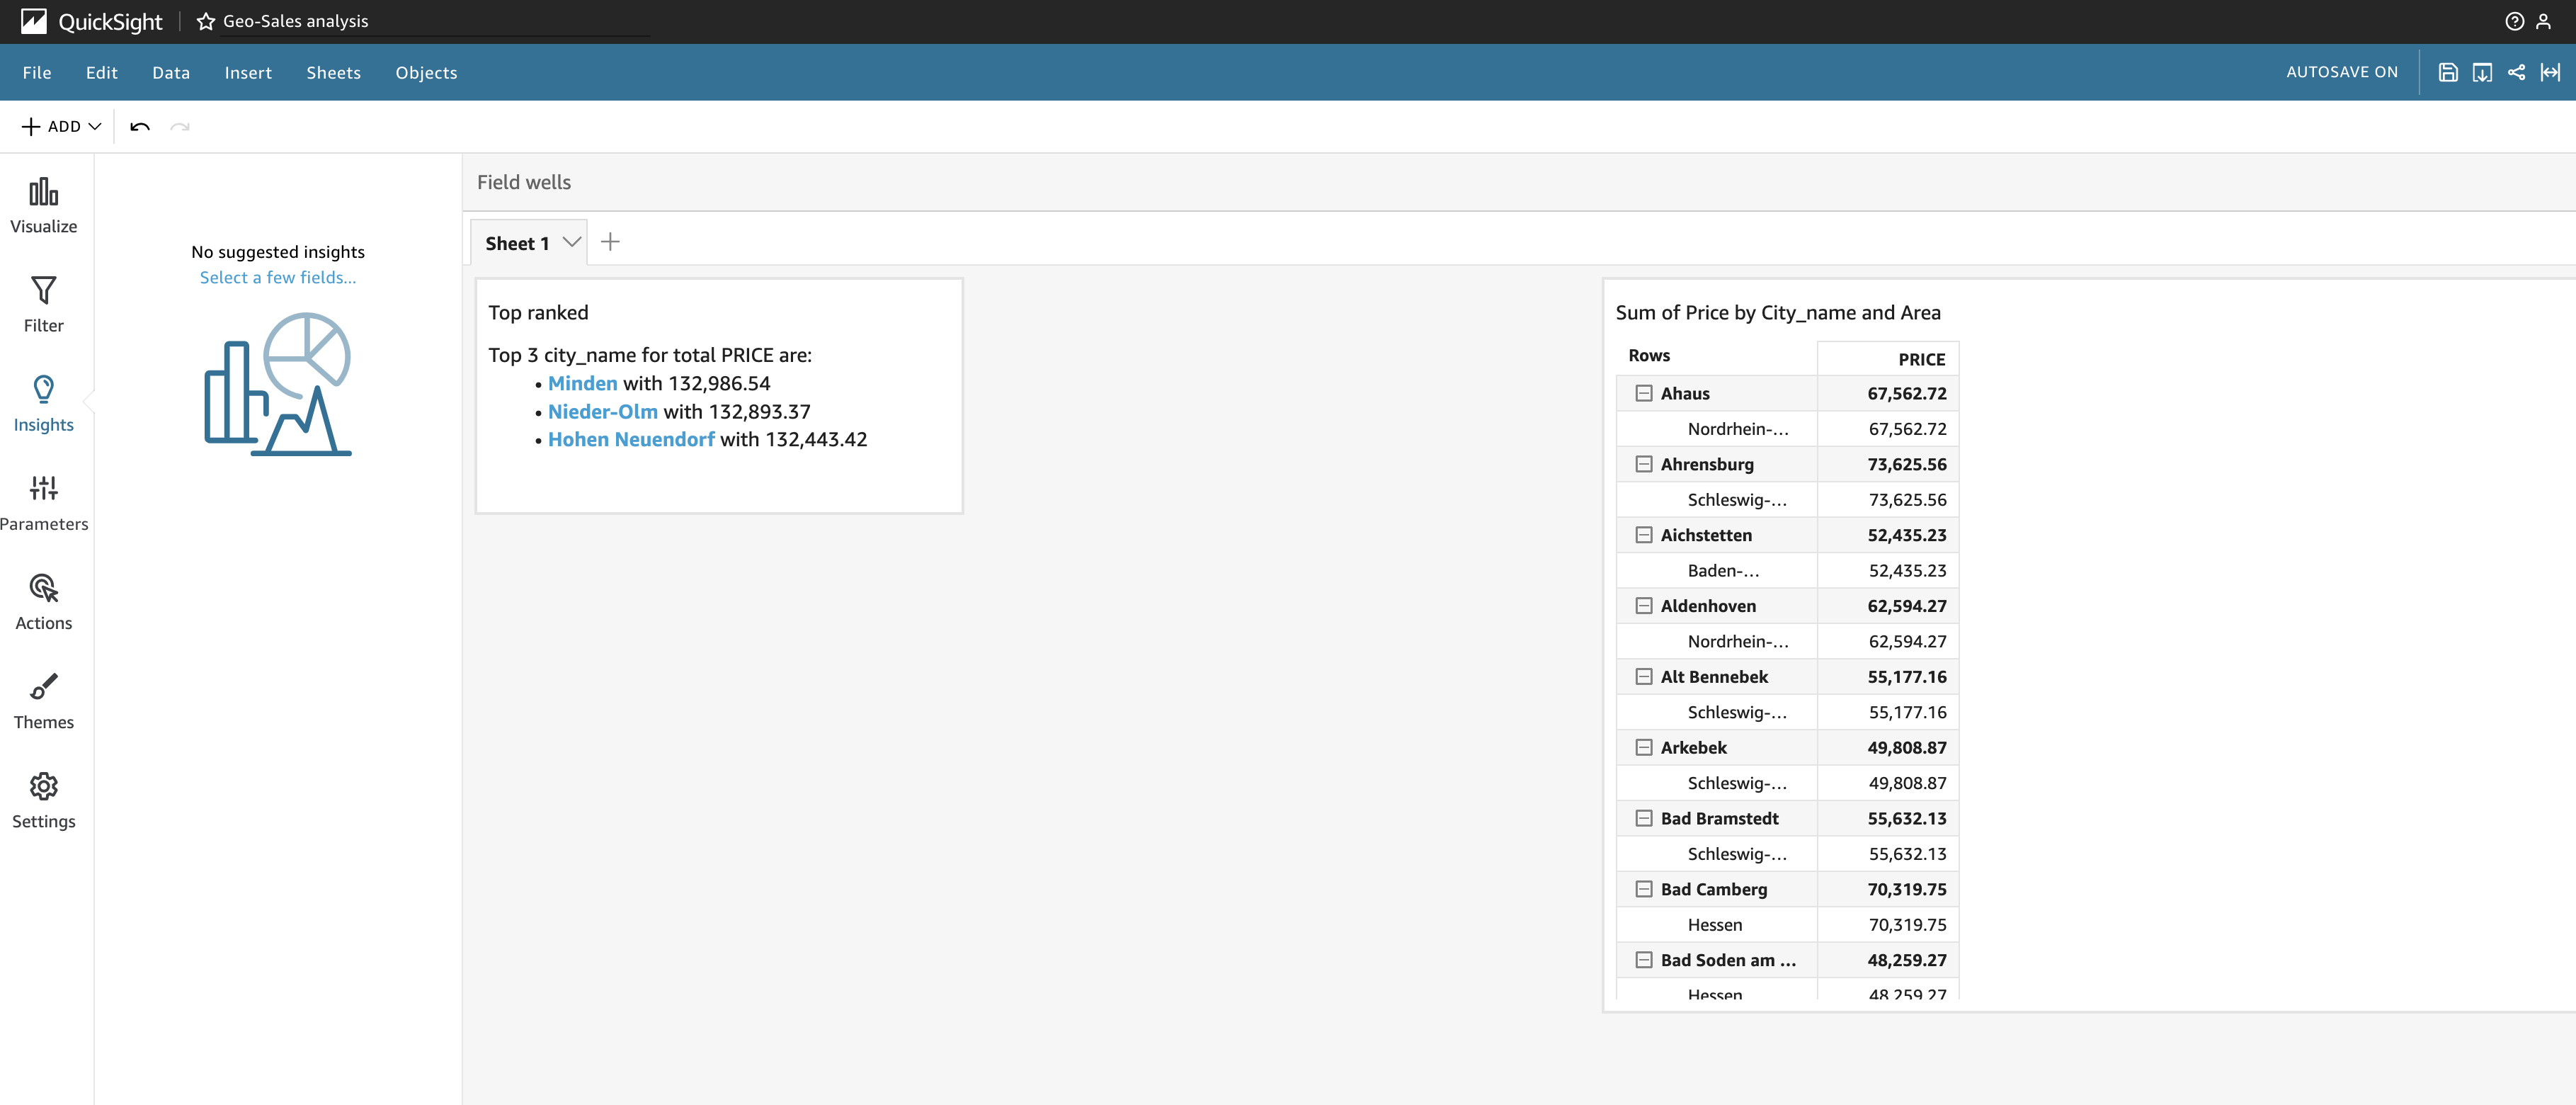
First select Pivot Table visual from the icons menu in the lower left corner, then select area, city_name PRICE from the list. You will see that QuickSight is assigning dimensional data to the rows section and metrics to the values section. Click in the upper right corner onto the three vertical dots and select Show Subtotals for Rows and Show Totals for Rows.
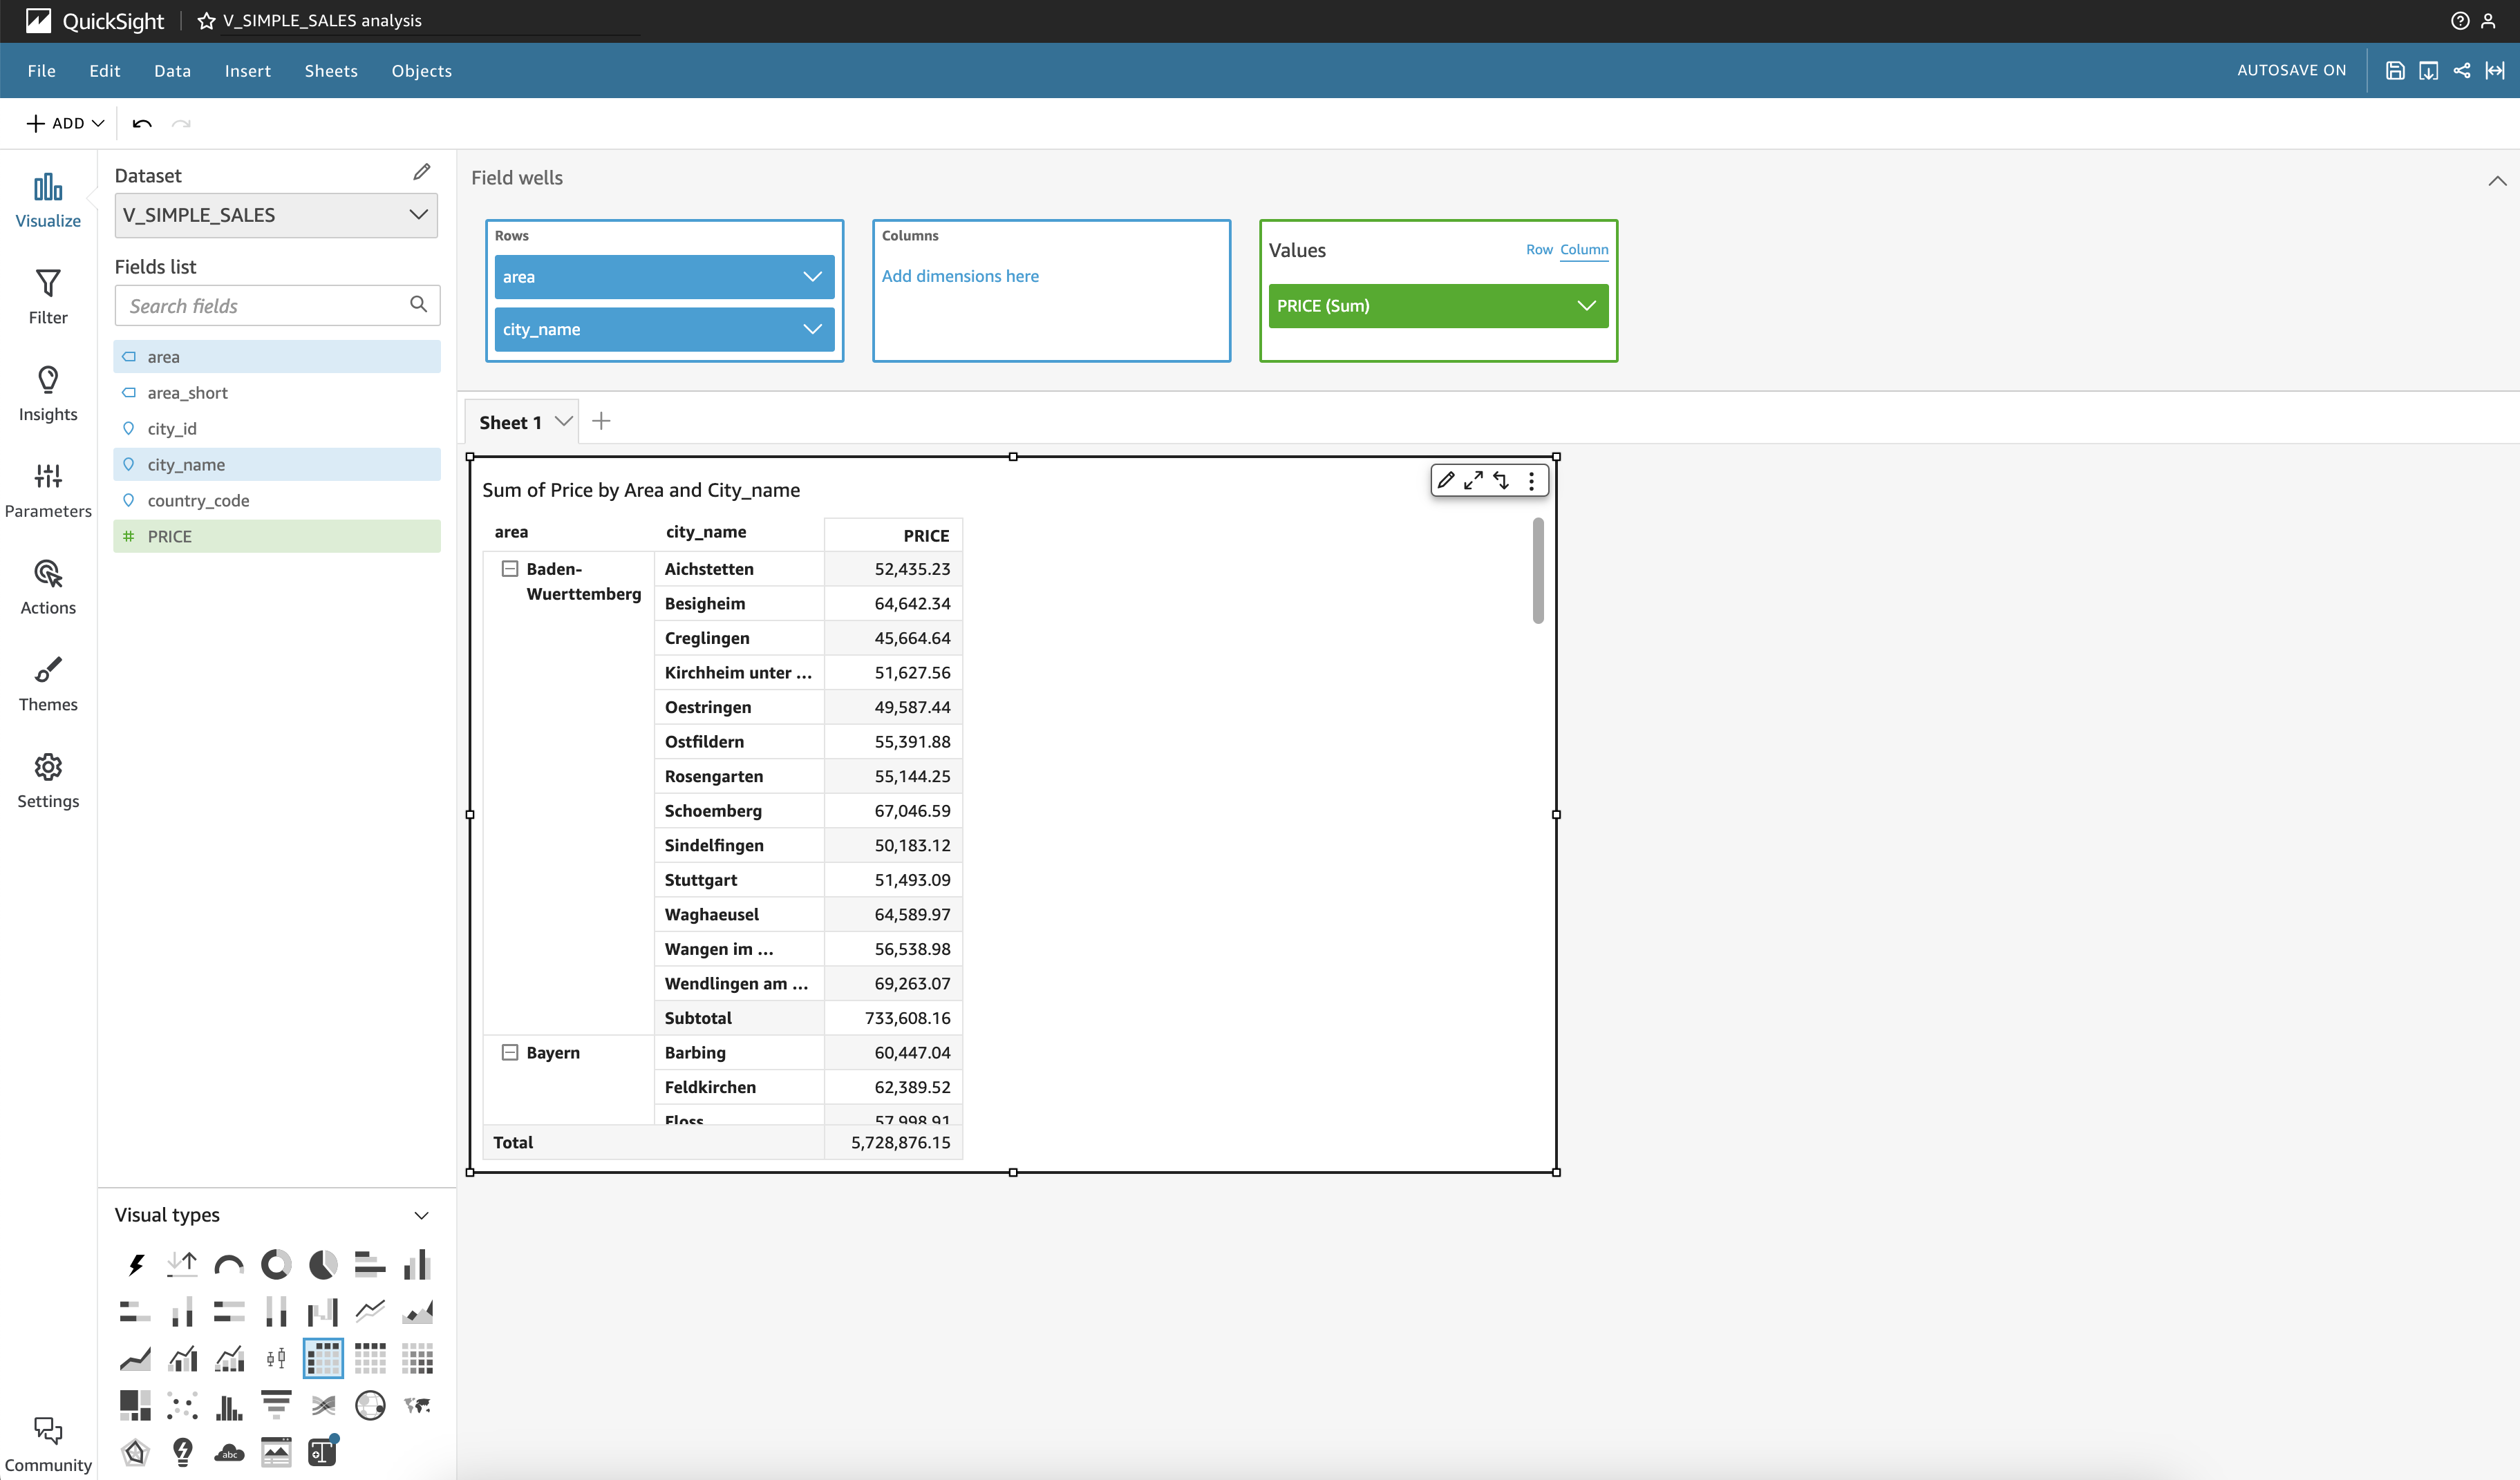
Whenever you add or remove a field from the selection list, the view will update itself automatically, as long as the view is selected. Perform a mouse click outside of the active pane to deselect the active view.
If you wonder for the slower than expected query response time, please remember that the CITIES table is residing as a textual file in a S3 bucket and not in the database itself. Querying this table requires an additional overhead, compared to querying a table stored in the database.
Again, select the same fields as before and click and the left side on Insights. QuickSight will take a few moments and offer you adequate first analytical queries based on the selected fields.
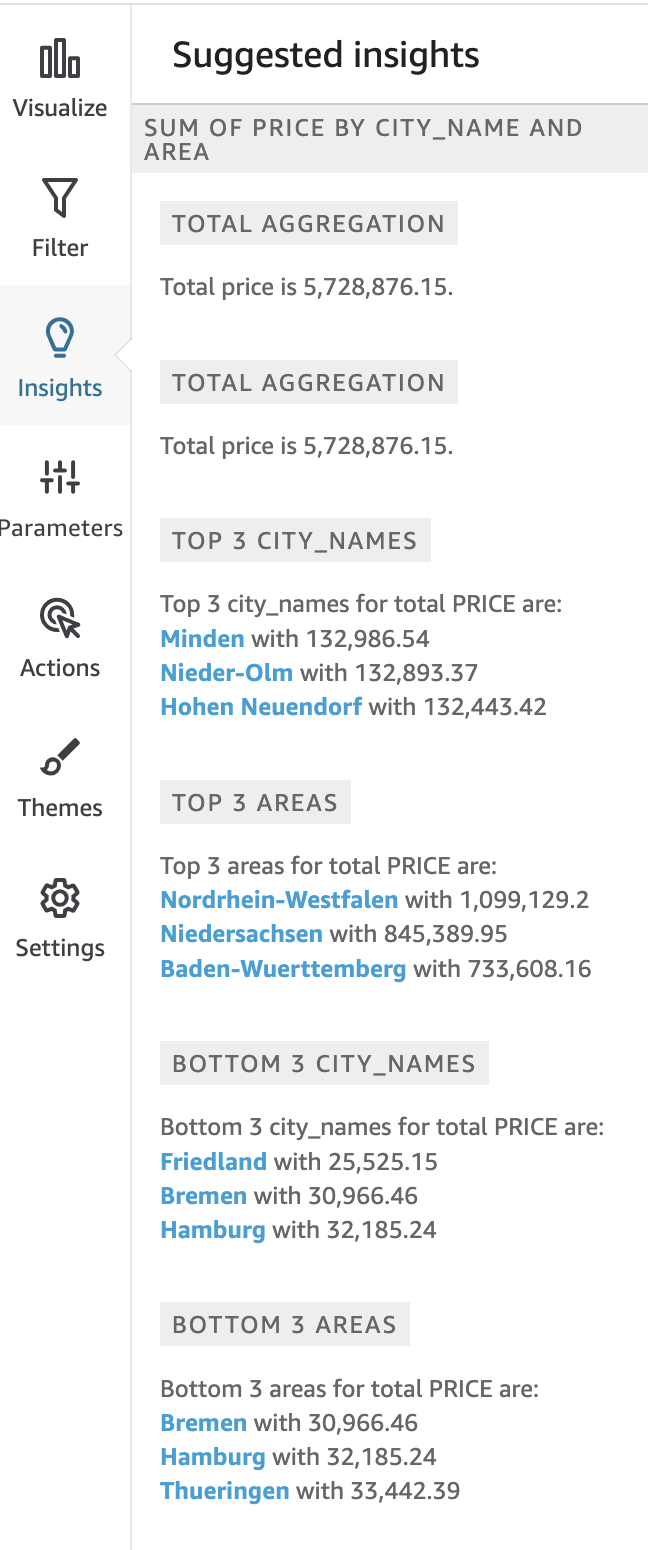
If you hover with the mouse over the suggestions a “plus” sign appears. Press it to add this suggestion to your canvas.
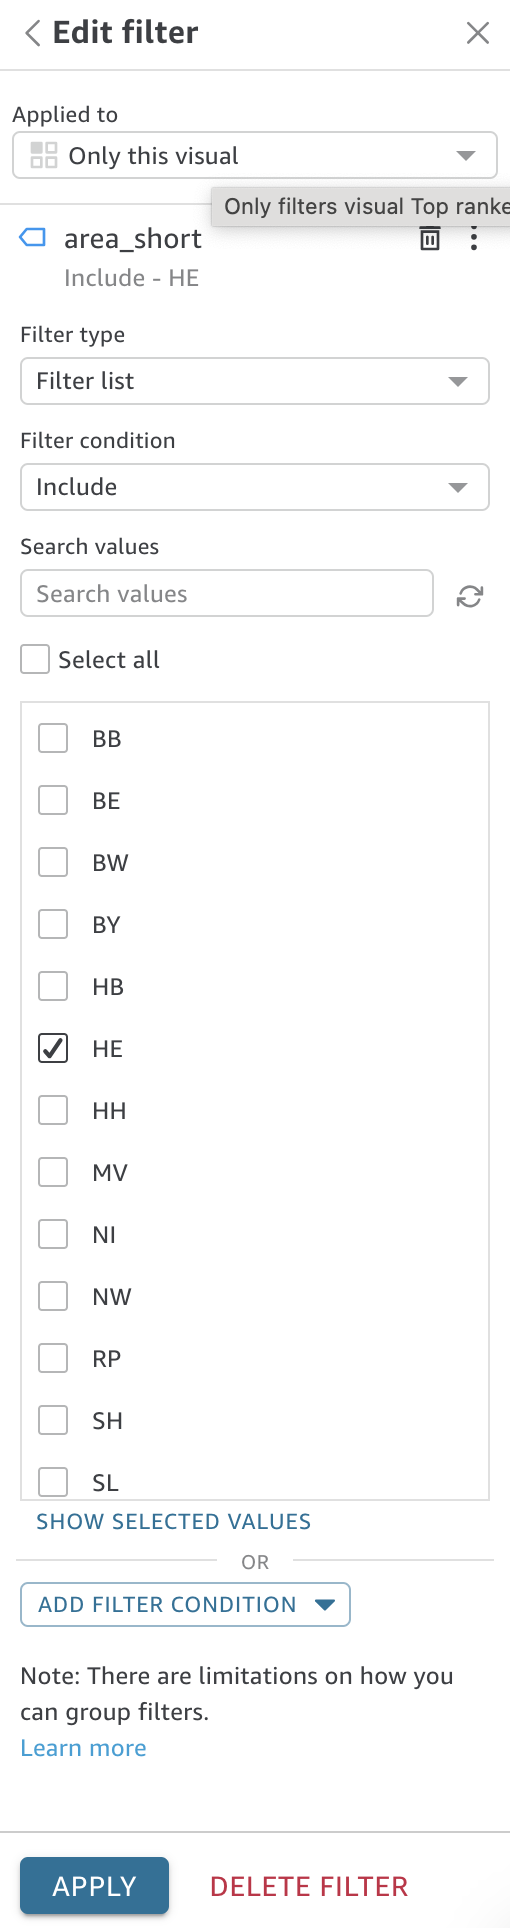
Finally, select the new visual which shows the result of your selected Insights suggestion. Click on the left side into filters and then Add Filter. Select the area_short field and fill the form as shown below:
You will see that the result of the Insights visual will change and adapt to the select area. The way we created this filter was that the filter only influences this single visual. Let’s change this to All Visuals of this Dataset. Apply the filter again and all visuals will adapt the results accordingly. Also, each visual now offers a funnel icon which represents one or more filters:
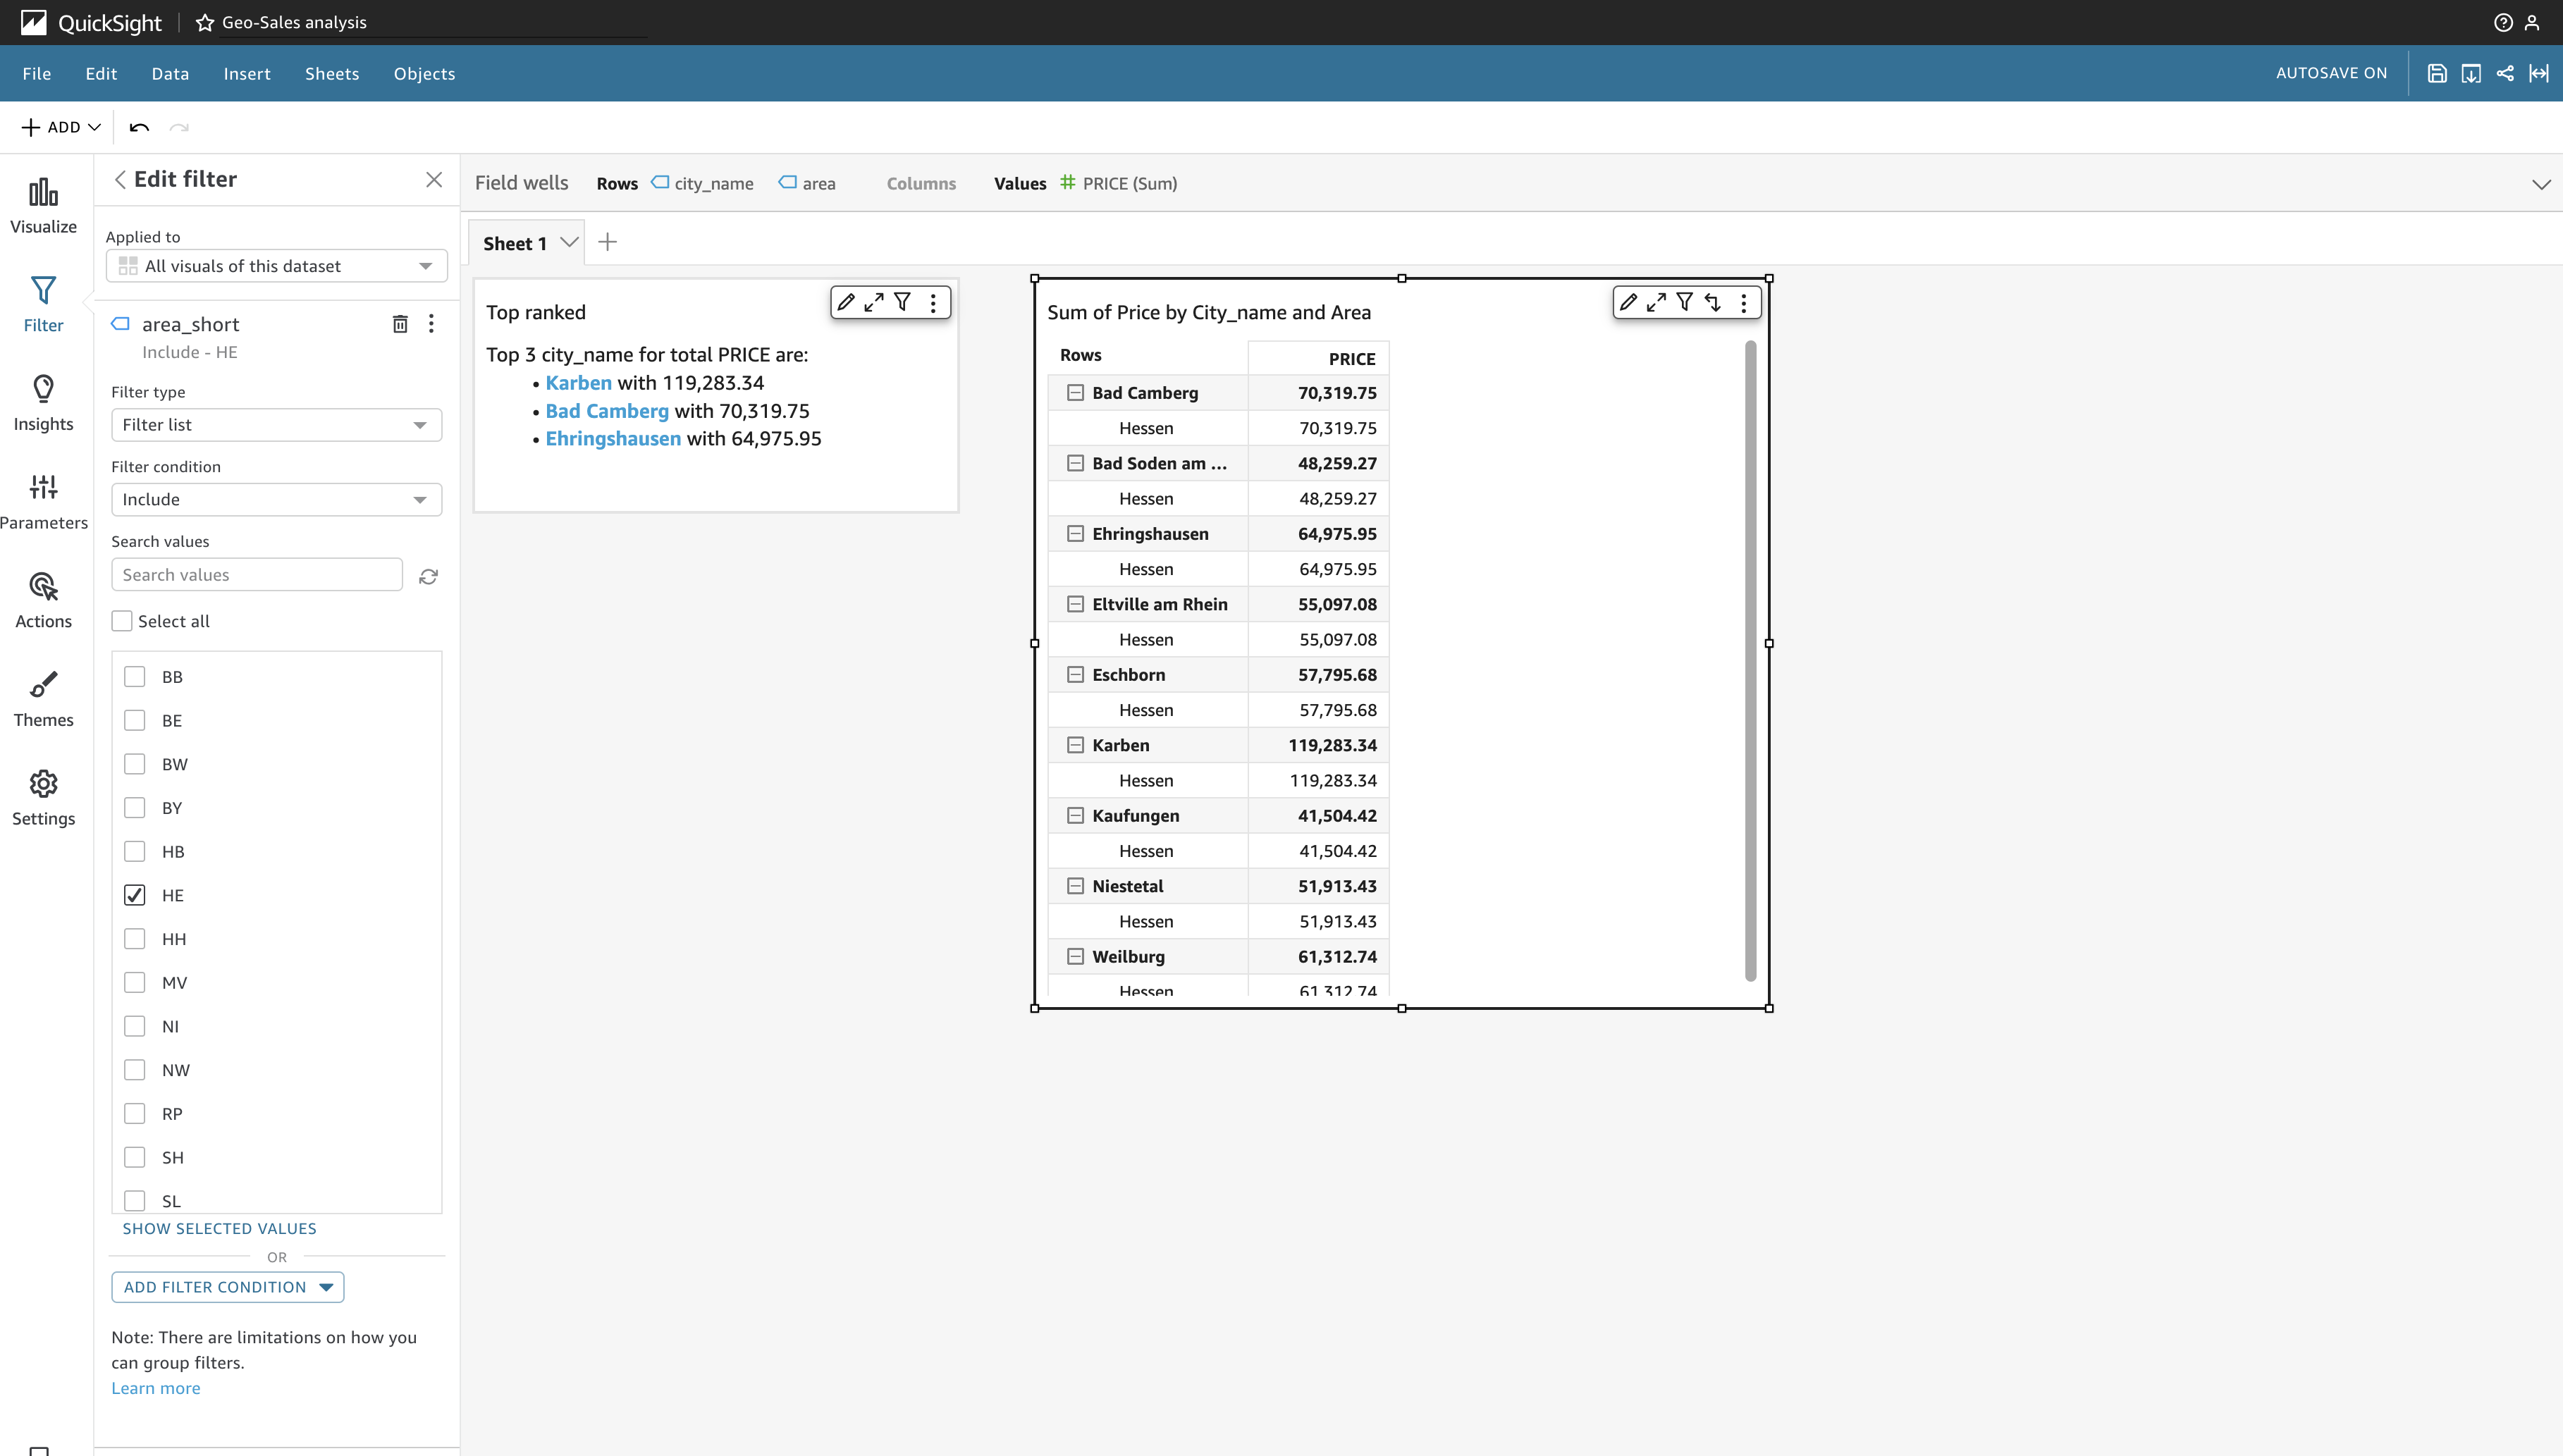
Also, in the filters menu you can place the filter onto the canvas, so it is visble in the future dashboard att all times.
Each visual, when selected, can be re-sized or moved freely around for an individual layout. Also, you can change the type of visualization at any time. Try it yourself.
We want to extend the dashboard with the ARTICLES dimension. Therefore we need to modify our view on the database. Execute the following SQL statement on the database to modify our view:
CREATE OR REPLACE VIEW V_SIMPLE_SALES AS(
    SELECT 	C."city_id",
            C."country_code",
            C."city_name",
            C."area",
            C."area_short",
            S."PRICE",
            A."PRODUCT_GROUP",
            A."PRODUCT_CLASS",
            A."DESCRIPTION",
            SP."AMOUNT"

    FROM VS_ATHENA_WORKSHOP."cities" C JOIN
         RETAIL.MARKETS M          ON C."city_id" = M.CITY_ID JOIN
         RETAIL.SALES S            ON S.MARKET_ID = M.MARKET_ID JOIN
         RETAIL.SALES_POSITIONS SP ON S.SALES_ID = SP.SALES_ID JOIN
         ARTICLE A                 ON SP.ARTICLE_ID = A.ARTICLE_ID
If you are wondering why we added two tables instead of one, the RETAIL.SALES_POSITIONS table acts as a linking table to the RETAIL.ARTICLE table. In case you decide to query the CITIES table direct from the database instead from the virtual schema, execute the following SQL statement:
CREATE OR REPLACE VIEW V_SIMPLE_SALES AS(
    SELECT 	C."city_id",
            C."country_code",
            C."city_name",
            C."area",
            C."area_short",
            S."PRICE",
            A."PRODUCT_GROUP",
            A."PRODUCT_CLASS",
            A."DESCRIPTION",
            SP."AMOUNT"

    FROM RETAIL.CITIES C JOIN
         RETAIL.MARKETS M          ON C."city_id" = M.CITY_ID JOIN
         RETAIL.SALES S            ON S.MARKET_ID = M.MARKET_ID JOIN
         RETAIL.SALES_POSITIONS SP ON S.SALES_ID = SP.SALES_ID JOIN
         ARTICLE A                 ON SP.ARTICLE_ID = A.ARTICLE_ID
Both views will produce the same results, the second view should show a much improved query response time.
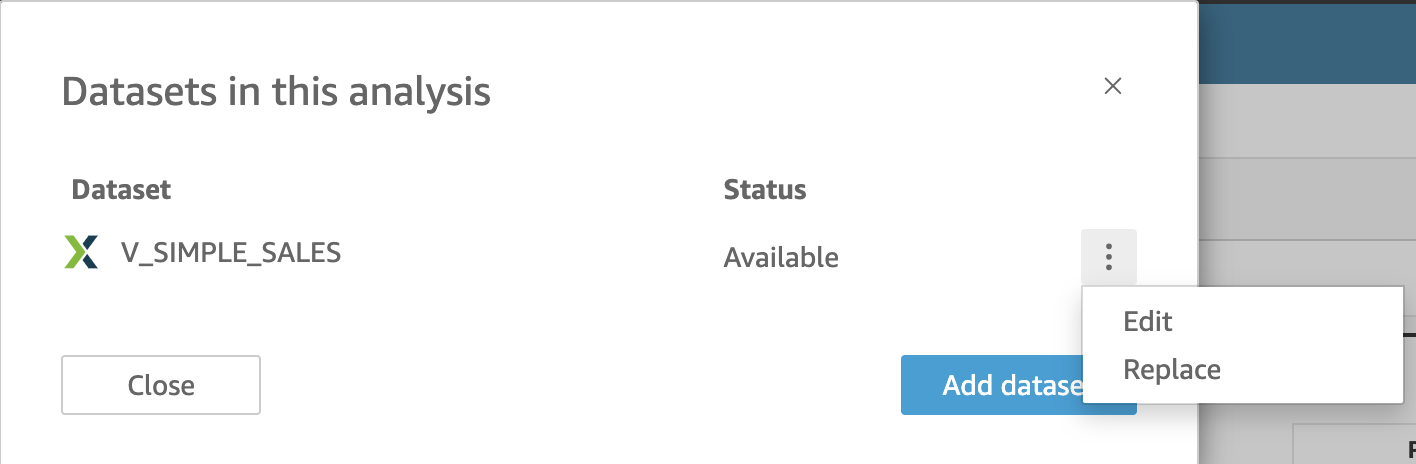
Go back to QuickSight in our Analysis and click onto the pencil right next to our dataset name we are working on. On the pop-up press the the dots and click Edit.
You will see that the fields list has been augmented as our underlying view has been modified. Press Save and Publish and return to our Analysis. Once again, this is exactly the reason why we assign dataset definitions to the database side, not to the client side - keep this in mind as a general rule when designing Data Warehouses.
Now select a Heatmap as a new visual and select PRODUCT_GROUP for the Group By and PRICE and AMOUNT for the size and color metrics. Re-organize the visuals on the canvas and save it again as a new version. However, if you want to stay with the current version, analysis has been autosaved - nothing to do. Click on the Share icon in the upper right corner to publish our Analysis as a Dashboard. It should look similar to the one below:
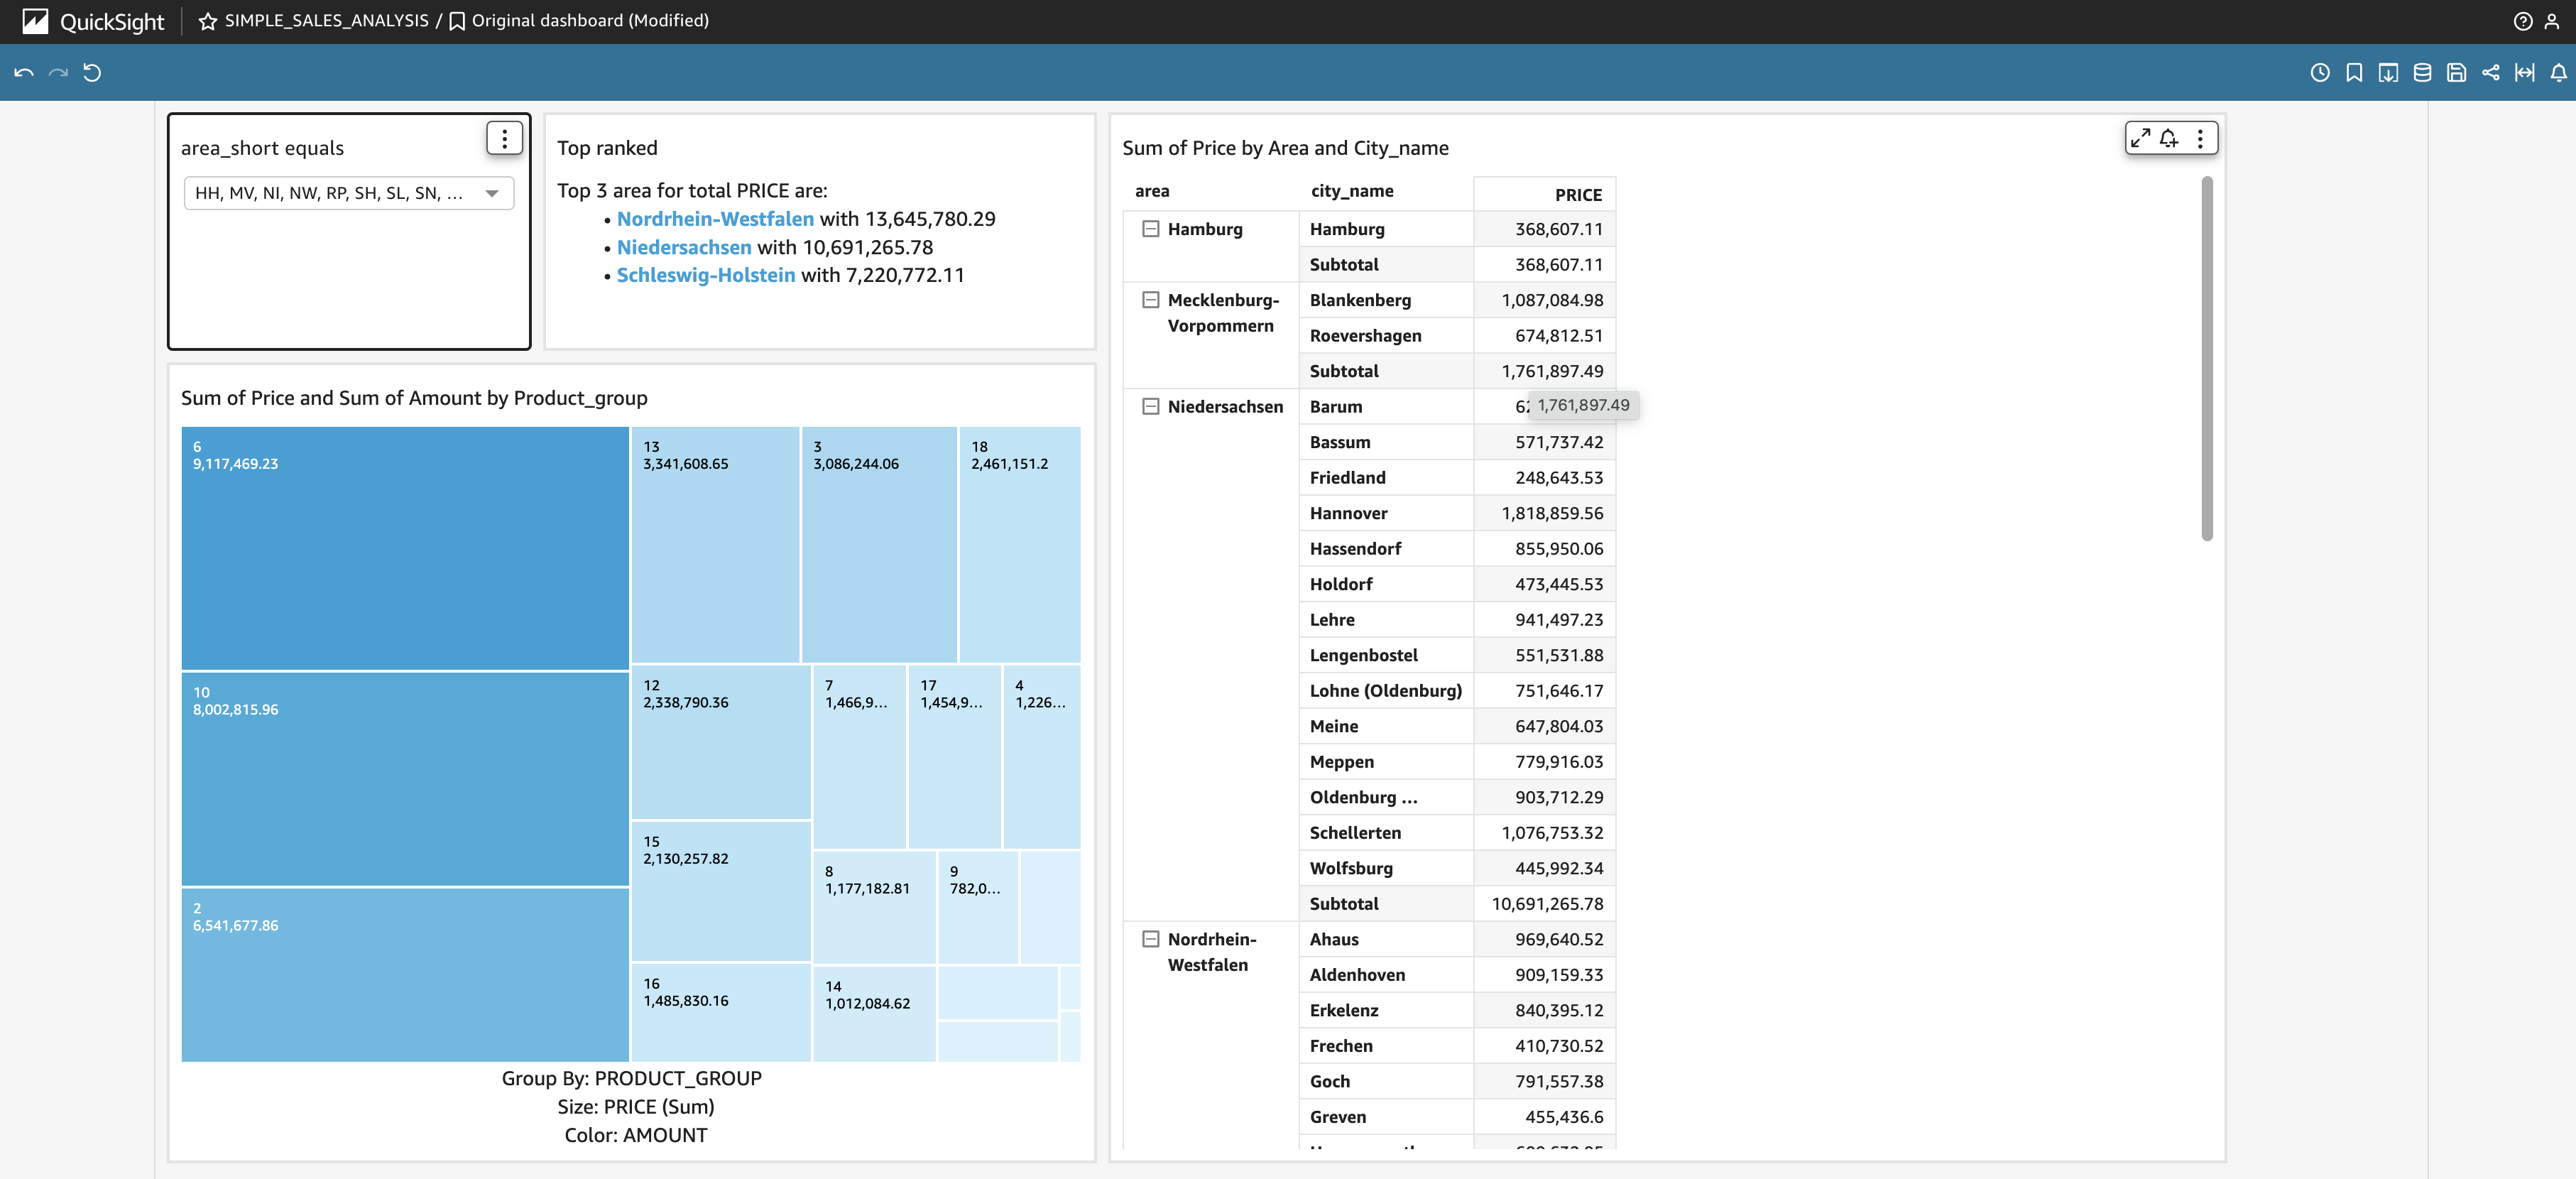
Congratulations, you have created your first anaylsis in AWS QuickSight with different visualizations, filters and insights. You should see the benefit from defining datasets on the database instead of defining them within the client tool, regardless of the vendor. While we defined the CITIES table as a remote one using AWS Athena, we are using the CITIES table on the database when we augmented our analysis. Feel free to create other visuals based on our simple sales model. If you have finished your work with AWS QuickSight let’s continue to the next section and see how we can use an autmated Machine Learning approach with AWS SageMaker.
Do not forget to unsubscribe from the AWS QuickSight service, otherwise you will be charged for the service.