Loading Data
We need to load some data into the database. For the time being, we import data using DBVisualizer or the SQL client of your choice. Before we can import the data, copy the following “CREATE” statements and execute it with the SQL client:
DROP SCHEMA IF EXISTS retail CASCADE;
CREATE SCHEMA retail;

CREATE TABLE RETAIL.CITIES (
    CITY_ID      DECIMAL(9,0),
    COUNTRY_CODE VARCHAR(2) UTF8,
    ZIP_CODE     VARCHAR(20) UTF8,
    CITY_NAME    VARCHAR(200) UTF8,
    DISTRICT     VARCHAR(50) UTF8,
    AREA         VARCHAR(50) UTF8,
    AREA_SHORT   VARCHAR(50) UTF8,
    LAT          DECIMAL(9,6),
    LON          DECIMAL(9,6)
);

CREATE TABLE RETAIL.ARTICLE (
    ARTICLE_ID         DECIMAL(9,0),
    DESCRIPTION        VARCHAR(100) UTF8,
    EAN                DECIMAL(18,0),
    BASE_SALES_PRICE   DECIMAL(9,2),
    PURCHASE_PRICE     DECIMAL(9,2),
    PRODUCT_GROUP      DECIMAL(9,0),
    PRODUCT_CLASS      DECIMAL(9,0),
    QUANTITY_UNIT      VARCHAR(100) UTF8,
    TMP_OLD_NR         DECIMAL(9,0),
    PRODUCT_GROUP_DESC VARCHAR(100) UTF8,
    DISTRIBUTION_COST  DECIMAL(9,2)
);

CREATE TABLE RETAIL.MARKETS (
    MARKET_ID   DECIMAL(9,0),
    LONGITUDE   DECIMAL(9,6),
    LATITUDE    DECIMAL(9,6),
    POSTAL_CODE CHAR(5) UTF8,
    CITY        VARCHAR(50) UTF8,
    AREA        VARCHAR(50) UTF8,
    CITY_ID     DECIMAL(9,0),
    POPULATION  DECIMAL(18,0)
);

CREATE TABLE RETAIL.SALES (
    SALES_ID                DECIMAL(18,0),
    SALES_DATE              DATE,
    SALES_TIMESTAMP         TIMESTAMP,
    PRICE                   DECIMAL(9,2),
    MONEY_GIVEN             DECIMAL(9,2),
    RETURNED_CHANGE         DECIMAL(9,2),
    LOYALTY_ID              DECIMAL(18,0),
    MARKET_ID               DECIMAL(9,0),
    TERMINAL_ID             DECIMAL(9,0),
    EMPLOYEE_ID             DECIMAL(9,0),
    TERMINAL_DAILY_SALES_NR DECIMAL(9,0),
    DISTRIBUTE BY SALES_ID
);

CREATE TABLE RETAIL.SALES_POSITIONS (
    SALES_ID    DECIMAL(18,0),
    POSITION_ID DECIMAL(9,0),
    ARTICLE_ID  DECIMAL(9,0),
    AMOUNT      DECIMAL(9,0),
    PRICE       DECIMAL(9,2),
    VOUCHER_ID  DECIMAL(9,0),
    CANCELED    BOOLEAN,
    DISTRIBUTE BY SALES_ID
);

CREATE TABLE RETAIL.DIM_DATE (
    SALES_DATE DATE
);
It is notable, that Exasol does not define indexes for an accelerated access to the required data. Exasol will create indexes automatically during the execution of a SQL query - based on the evaluation of the SQL statement - and maintains the index for further operations. Indexes not used for more than 35 days (5 weeks) will be removed from the system. If a query is slow when executed for the first time, execute it a second time, so it utilizes the newly created index. However, we define a so-called “Distribution Key” per table, which instructs Exasol how to distribute data amongst the cluster nodes.
Next, we need to create a connection from the database to the S3 bucket. Issue the following command in your SQL client. The key information are the id and secret from your personal AWS Access Key, the connection name is your personal choice:
CREATE CONNECTION S3_EXASOL_DATA
TO 'https://s3-aws-modernization-workshop.s3-eu-central-1.amazonaws.com'
USER '<your-personal-key-id>'
IDENTIFIED BY ‘<your-personal-secret-key>';
Now, we can import the previously uploaded data files into the database. If you want to see how data can be uploaded with Amazon’s AWS Glue ETL service, leave the CITIES table untouched:
IMPORT INTO RETAIL.ARTICLE FROM CSV AT S3_EXASOL_DATA
FILE 'SOURCE_DATA/RETAIL_MINI/ARTICLE.csv';

IMPORT INTO RETAIL.CITIES FROM CSV AT S3_EXASOL_DATA
FILE 'SOURCE_DATA/RETAIL_MINI/CITIES.csv';

IMPORT INTO RETAIL.DIM_DATE FROM CSV AT S3_EXASOL_DATA
FILE 'SOURCE_DATA/RETAIL_MINI/DIM_DATE.csv';

IMPORT INTO RETAIL.MARKETS FROM CSV AT S3_EXASOL_DATA
FILE 'SOURCE_DATA/RETAIL_MINI/MARKETS.csv';

IMPORT INTO RETAIL.SALES FROM CSV AT S3_EXASOL_DATA
FILE 'SOURCE_DATA/RETAIL_MINI/SALES.csv';

IMPORT INTO RETAIL.SALES_POSITIONS FROM CSV AT S3_EXASOL_DATA
FILE 'SOURCE_DATA/RETAIL_MINI/SALES_POSITIONS.csv';
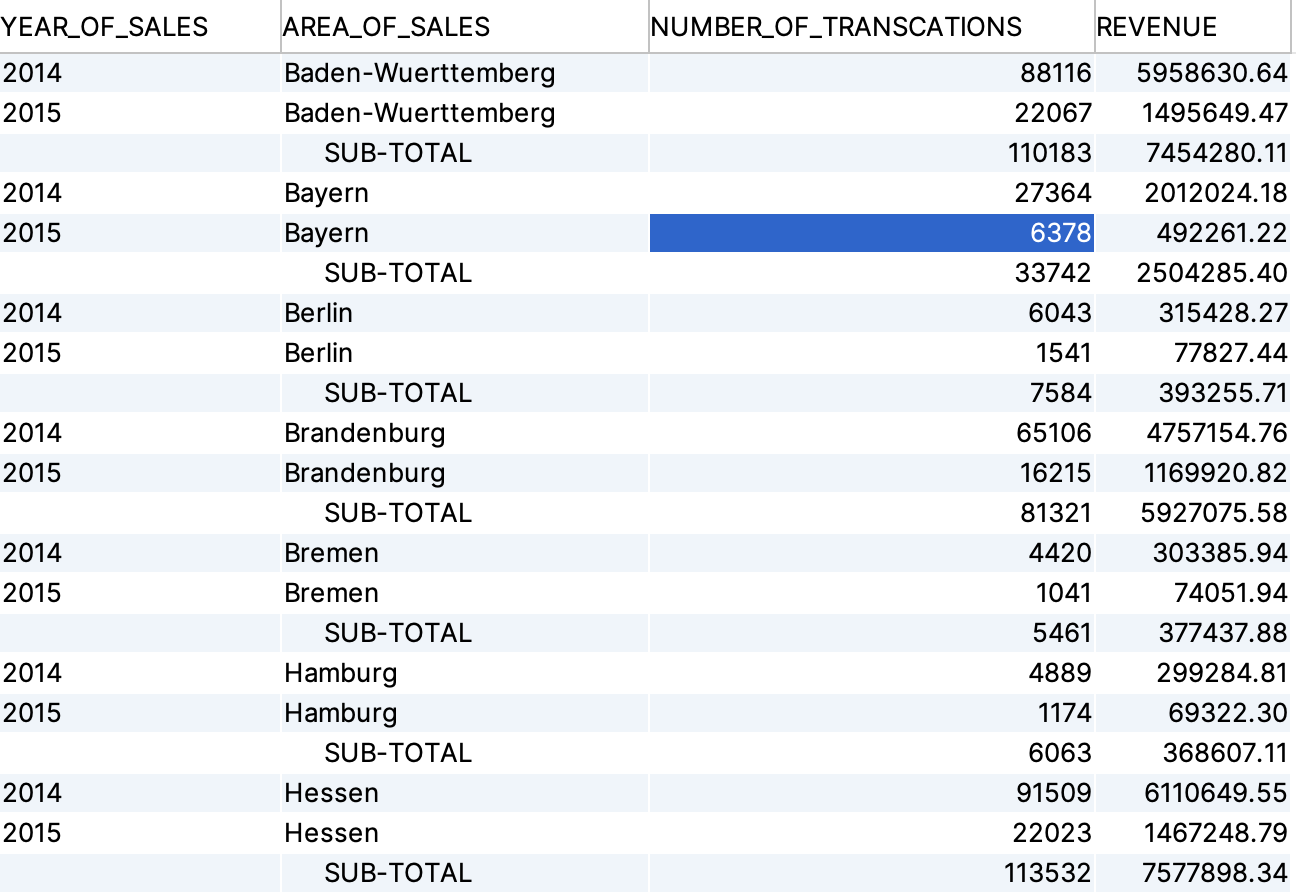
After importing the data, you can check if everything works fine by executing the SQL query below:
WITH HLP AS (
    SELECT  YEAR(S.SALES_DATE) AS Year_of_Sales,
            AREA               AS Area,
            count(S.SALES_ID)  AS Transactions,
            sum(S.PRICE)       AS EUROS

    FROM RETAIL.SALES S
        JOIN RETAIL.SALES_POSITIONS SP ON S.SALES_ID = SP.SALES_ID
        JOIN RETAIL.ARTICLE A ON SP.ARTICLE_ID = A.ARTICLE_ID
        JOIN RETAIL.MARKETS M ON S.MARKET_ID = M.MARKET_ID

GROUP BY ROLLUP (local.Year_of_Sales), local.Area

ORDER BY local.AREA, local.Year_of_Sales )


SELECT IF YEAR_OF_SALES IS NULL THEN ' '
                                ELSE YEAR_OF_SALES ENDIF  AS Year_Of_Sales,
       IF YEAR_OF_SALES IS NULL THEN '     SUB-TOTAL'
                                ELSE AREA ENDIF           AS Area_Of_Sales,
       TRANSACTIONS                                       AS Number_Of_Transcations,
       EUROS                                              AS Revenue

FROM HLP;
You should receive a query result, giving you an overview about basic sales performance per year and per region with a rollup per year:
Great! We have an operational cluster, let’s continue to the next step.